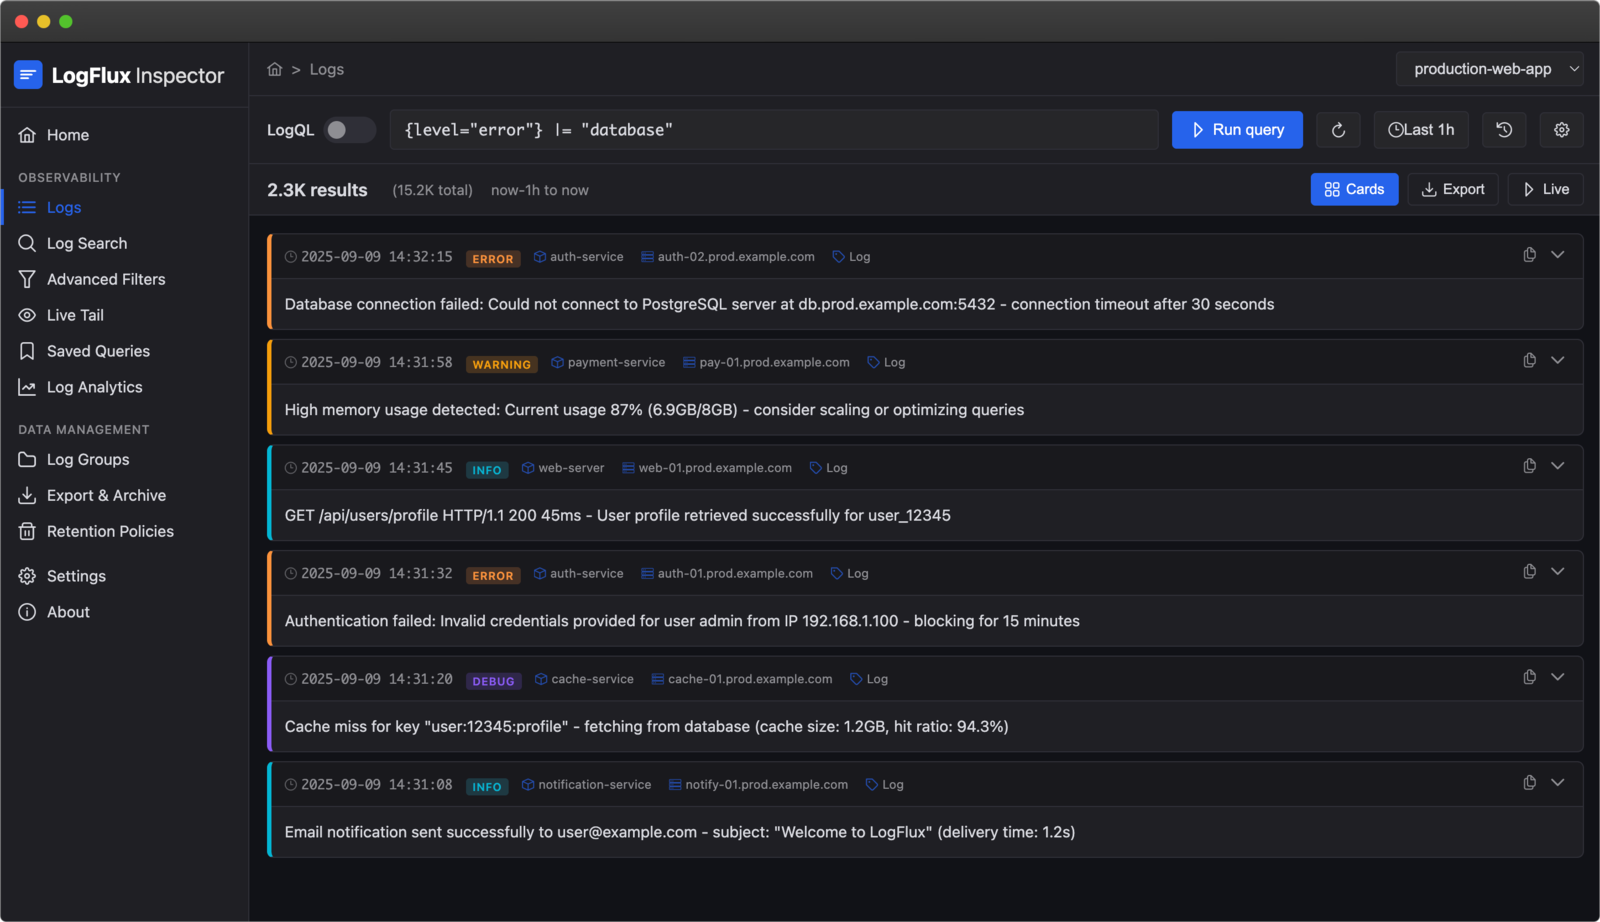
Professional Log Management in 60 Seconds
One-line install. View anywhere. Zero infrastructure.
One-line install • Zero infrastructure • Grafana, CLI, or API • Production-ready
Complete Inspector Toolkit
Comprehensive log analysis tools including CLI and web-based dashboards. Real-time streaming with sub-second latency for instant log visibility.

Everything you need for log management
Production-ready from day one. Works with your existing tools.
Scalable Architecture
High-performance backend with automatic data partitioning and multi-region deployment support for global scale.
End-to-End Encryption
Military-grade encryption with client-side key management. Complete multi-tenant isolation ensures your data stays private.
Complete REST API
Interactive documentation with regional endpoint routing and comprehensive API coverage for all operations.
Global Data Residency
Data residency compliance across EU, US, CA, AU, and AP regions with battle-tested infrastructure management.
4 Language SDKs
Go, Python, Java, JavaScript SDKs with consistent APIs and built-in encryption for major programming languages.
Universal Collection
30+ integrations including Docker, Kubernetes, OpenTelemetry, StatsD, Fluentd, Zipkin, cloud providers, databases, and web servers.
Monitor any stack with 30+ integrations
Seamless integration with your existing infrastructure and tools
Easy Integration
Official SDKs for Go, Python, Java, and JavaScript with consistent APIs
import (
    "context"
    "github.com/logflux-io/logflux-go-sdk/pkg/client"
    "github.com/logflux-io/logflux-go-sdk/pkg/types"
)

// Create client and send log
c := client.NewUnixClient("/tmp/logflux-agent.sock")
ctx := context.Background()
c.Connect(ctx)
defer c.Close()

entry := types.NewLogEntry("Hello, LogFlux!", "my-loggroup").WithLogLevel(types.LevelInfo)
c.SendLogEntry(entry)Ready to Ship Logs Without the Overhead?
Perfect for solo developers, startups, and growing teams. From side project to scale-up - no servers to manage.